Visualize Git Branches & Releases Inside Jira with Mermaid GitGraph
Your team is mid-debug on a prod incident. A senior engineer asks "which release shipped this commit, and why is it on the release branch when the PR said main?" — and nobody can answer without switching between Jira, the git web UI, and a Slack thread. That context — commit history, branches, merge points, release versions — belongs next to the issue, not in a tool people have to leave Jira to open.
Quick answer: paste a Mermaid gitGraph into the issue's Mermaid Plus Diagrams for Jira panel and the branch history renders as a diagram right on the ticket — commits, branches, merges, and release tags, all in one editable text block. This post gives you three copy-paste examples: a trunk-based feature workflow, a hotfix outside the release window, and a branch-rule flowchart to keep behavior consistent.
Why branch history belongs on the issue
A Jira issue tracks work: what was asked, who owns it, what it did to the system. Once the PR merges, that story leaves the ticket — the work is closed, and the git history that actually changed the product lives somewhere else. The next person who opens the issue for a bug report gets a resolved ticket with no visible trace of what touched the codebase.
A gitGraph closes that gap by putting the change story back on the ticket. Look at what a single gitGraph block answers at a glance:
- Which branch introduced the change (and whether it touched
maindirectly) - Where the merge point was — and therefore what a revert would roll back
- When a release tag landed relative to the merge
- Whether the work went in as one clean line or was rebased, split, and squashed
Atlassian's own deep-dive on Mermaid text diagrams calls this the "diagram as conversation" — a graph you can point at in a review and say "here is where it broke".
Copy-paste 1: trunk-based feature workflow
The first diagram is the everyday pattern: work on a short-lived branch, review, merge to main, then ride the release train. Paste this into the Mermaid Plus panel on the story's issue:
gitGraph
  title Trunk-based feature workflow
  commit id: "start"
  branch feature/payment-retry
  checkout feature/payment-retry
  commit id: "feat: retry with backoff"
  commit id: "fix: idempotency key"
  checkout main
  commit id: "chore: dep updates"
  merge feature/payment-retry
  commit id: "release: sprint 42"
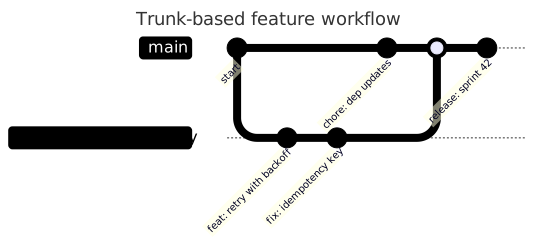
Because it is text, this graph updates the way your git history actually does — a new commit is one line, a merge is one keyword. No dragging nodes, no re-connecting arrows. The four gitGraph verbs (commit, branch, checkout, merge) are the whole vocabulary.
Copy-paste 2: a hotfix outside the release window
Production is broken and the fix cannot wait for the next release train. The reality of that moment is: patch main, branch a release line, and keep the fix flowing back into the trunk and the pending feature branch — so the bug stays fixed everywhere it matters.
gitGraph
  title Hotfix outside the release window
  commit id: "v2026-09"
  branch release/2026-10
  checkout release/2026-10
  branch hotfix/payment-timeout
  checkout hotfix/payment-timeout
  commit id: "fix: raise timeout 10s -> 60s"
  checkout release/2026-10
  merge hotfix/payment-timeout
  checkout main
  merge hotfix/payment-timeout
  commit id: "release: v2026-09.2"
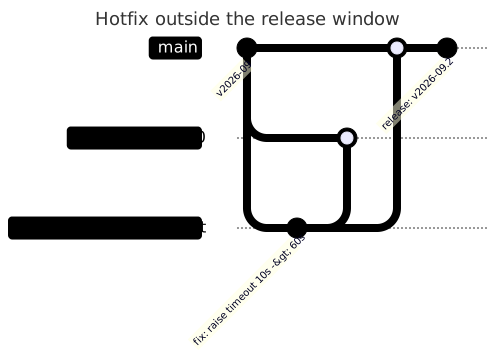
This is the diagram your postmortem will wish it had. When the incident review asks "was the fix on the release line and on main?", the graph answers in one glance — no git archaeology required.
Copy-paste 3: the branch-rule flowchart
A gitGraph shows what happened; a flowchart shows the rules — and a diagram is how a team agrees on those rules without a doc that nobody reads. A flowchart version of your branch strategy is the shared rulebook: flowcharts are the most-used Mermaid type in Confluence and Jira, and they read in code review as fast as they read on a whiteboard.
flowchart TD
  %% title: Branch rules PR to merge
  A[PR opened] --> B{Target branch?}
  B -->|main| C{Scope small enough?}
  B -->|feature/*| D[Review + run CI]
  C -->|Yes| D
  C -->|No| E[Open an epic]
  E --> E2[Track sub-branches on the epic]
  D --> F{CI green?}
  F -->|Yes| G[Squash merge]
  F -->|No| H[Fix on the branch]
  H --> D
  G --> I[PR closed]

Use one gitGraph per feature or release to show history, and keep this single flowchart as the shared rulebook in the space home — so "how do we branch around here?" has one canonical image.
Keeping the graph current (not a static screenshot)
The reason these work in practice is that the diagram is editable text living on the issue. A Mermaid panel in Mermaid Plus Diagrams for Jira behaves like a mini code editor — paste the syntax, see the live preview, save, and the rendered SVG stays on the issue. When a PR merges after the diagram is saved:
- Open the issue → click the diagram → Edit
- Add or edit the commit lines (there is no merge that needs re-dragging)
- Save — the graph re-renders with the new commit in place
A screenshot in an old Confluence page goes stale the moment a branch merges. A gitGraph on the issue is current whenever someone thinks to update it — which is inevitable, because the ticket is where you look first when the bug lands.
Where this lives beside the rest of your Jira diagrams
This is the branching half of the DevOps picture; the other half is the pipeline. Keep your release schedule on the epic as a Gantt (release timeline in Jira), your branch history on the feature issues as a gitGraph, and your sprint cadence separate — sprint workflow and release history are different plots on the same calendar (sprint to release mapping).
FAQ
Does Jira show git branches automatically? Jira's development information panel lists threads and PRs connected to an issue, but it is a flat list. A Mermaid gitGraph is the topology — branches, merges, and release tags as a diagram, not a feed.
Can I render a gitGraph inside a Jira issue?
Yes — Mermaid Plus Diagrams for Jira renders gitGraph in the issue's Mermaid panel. Paste the syntax, preview live, save, and everyone who opens the ticket sees the graph.
How do I show a release version in a gitGraph?
Label a commit on main with the version string (commit id: v2026-09), or split a release branch and merge fixes in — the hotfix example above shows both.
Is a gitGraph better than a flowchart for branch strategy? Use a gitGraph for history (what happened) and a flowchart for the rulebook (what should happen). They complement each other; the flowchart in this guide is the rulebook half.
Get the full 26-diagram set — flowcharts, sequence, ER, Gantt, C4, and yes, gitGraph — in Mermaid Plus Diagrams for Jira, free for up to 10 users.
Try Mermaid Plus for Confluence
All 29 Mermaid diagram types with live preview and one-click templates — free for up to 10 users.
Get it on the Atlassian Marketplace