Root Cause Analysis in Confluence with Mermaid Fishbone + 5 Whys
A root cause analysis is only as good as the disagreement it survives. When the 'root cause' box on your postmortem template contains one sentence, the meeting spends an hour relitigating that sentence. A fishbone diagram and a 5 Whys chain move the argument onto a diagram: everyone sees which categories were considered, which branch was chosen, and exactly how the 'why' answers arrive at a root cause.
Confluence is where RCA already happens — in the Root Cause Analysis template, in postmortems, in retros. The missing piece is a diagram that holds the reasoning. This guide shows you two copy-paste Mermaid diagrams: an ishikawa fishbone that maps every candidate cause category, and a flowchart 5-Whys drilldown that lands on one concrete fix.
Quick answer: To run root cause analysis in Confluence, install Mermaid Plus for Confluence, open the RCA/postmortem page, and paste an ishikawa fishbone — the problem at the head, one branch per cause category (Platform, People, Process, Policy, Product, External). Then drill the winning branch with a flowchart-based 5 Whys, asking 'why' at each node until the answer is an assignable fix. Copy both examples below. The diagrams hold the reasoning so the review argues about fixes, not about what happened.
Why a Whiteboard Fishbone Leaves a Gap
Teams draw fishbones on whiteboards because the shape is useful — but the whiteboard drawing dies the moment it's transcribed. A photo in the meeting notes is not editable, it's not linked to the action items, and it doesn't survive the space rename. The RCA then lives as a text box with the fishbone's conclusion but none of its reasoning.
A text-editable Mermaid fishbone on the Confluence page fixes all three:
- It stays editable — the cause list is code; adding a cause is one line and a republish, not a redraw.
- It stays with the document — the diagram is inside the postmortem, version-controlled with every edit, exported with the PDF.
- It links downstream — the branch you drill with 5 Whys can point at the exact action item in the same page.
The result is that the RCA page becomes the reasoning, not a summary of it.
Copy-Paste Fishbone — Six Cause Categories
Here is an ishikawa diagram sized for a software incident. Like the classic 6M fishbone, it uses six categories — but mapped to what a platform team actually has branches for. Swap the labels and causes for your own incident:
ishikawa
  direction XY
  title Why payments lagged 12 minutes
  Platform
    Database locked up
    Read replicas stalled
  People
    No on-call rotation
    Single bus factor
  Process
    No runbook
    Manual retry loop
  Policy
    No timeout on retries
    Alert threshold too high
  Product
    Client waits 30s by default
  External
    Payment provider degraded
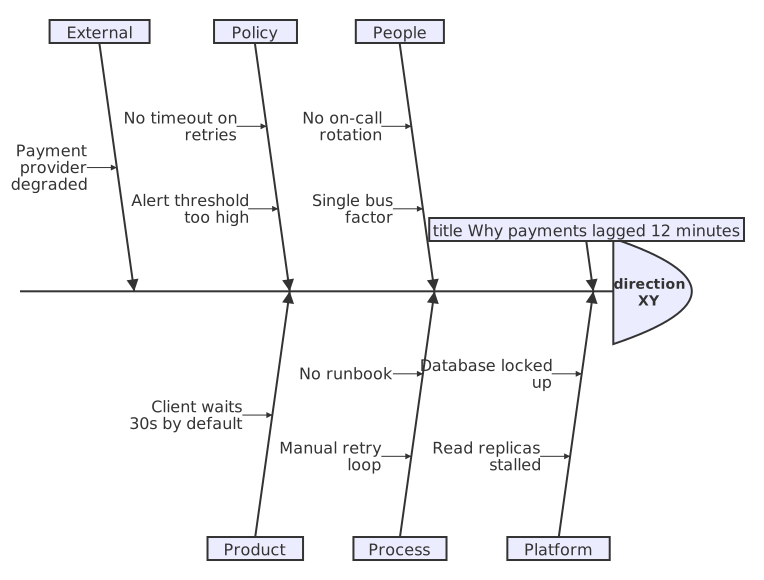
Read it the way a fishbone is read: the head is the problem, each branch is a cause area, and the leaves are candidate causes. direction XY lays the spine out horizontally (the classic fishbone read); the default vertical is fine too, but horizontal reads best pasted under a 'Root Cause' heading.
Notice what the diagram forces you to consider: the lock-up sits in Platform, but 'No timeout on retries' in Policy and 'Manual retry loop' in Process are different kinds of causes. A single-sentence 'root cause' box would collapse all three into one; the fishbone keeps the branches visible, which is exactly what a review needs to cross out options.
The 5 Whys as a Flowchart
The fishbone narrows the field. The 5 Whys picks a branch and drills it. As a Mermaid flowchart, each level asks 'why' about the previous answer, and the chain terminates the moment the answer is an assignable change:
flowchart TD
    %% title: The 5 Whys as a Flowchart
    Q1["Why did the checkout time out?"] --> A1["Payment provider was slow"]
    A1 --> Q2["Why was the provider slow?"]
    Q2 --> A2["Our retry called it twice, doubling queue load"]
    A2 --> Q3["Why did we retry on every failure?"]
    Q3 --> A3["The timeout policy treated timeouts like errors"]
    A3 --> Q4["Why did the policy treat them the same?"]
    Q4 --> A4["No retry governance for payment paths"]
    A4 --> R["Fix: add retry budget + fast-fail on checkout"]

The last node is not an explanation — it is a fix. That is the whole point of a 5 Whys in a postmortem: the drill stops when 'why' produces something you can assign. If the chain runs past five levels and the answer is still abstract ("lack of observability"), you drilled the wrong branch — go back to the fishbone and pick another.
From Fishbone to Root Cause to Action Item
The two diagrams earn their place when they connect to a tracker. On the same postmortem page, one line under an Action Items heading ties the chain together:
Add a retry budget to payment checkout and fast-fail on timeouts (from the 5 Whys chain above: Policy branch → root cause #4).
That anchor link is the point: the action item references the diagram node, the diagram shows the reasoning, and the postmortem stops being a report and becomes a decision log. Teams that do this find the review meeting shrinks, because there is nothing left to litigate — the candidates are on the board, crossed out or confirmed.
Where It Sits Beside the Timeline Post
The fishbone is the analysis half of a postmortem; the incident timeline is the facts half. The reading order matters: timeline first (this is what happened), then fishbone + 5 Whys (here is why), then action items (here is the fix).
| Postmortem stage | Diagram | Job |
|---|---|---|
| What happened | timeline | Chronological facts, detection to resolution |
| What was considered | ishikawa fishbone | Six cause categories, no stone unturned |
| What is the actual cause | flowchart 5 Whys | Drill one branch to an assignable fix |
| What we change | action item list | The fix as a tracked task |
If the RCA page lives in Markdown instead of the WYSIWYG editor, the same fences render inside Enhanced Markdown for Confluence — so teams writing incident reviews in Markdown get the same diagrams.
Which Cause Categories for Software?
| Category | What it holds | Software example |
|---|---|---|
| Platform | Infrastructure, databases, networking | Database lock-up, replica lag |
| People | Staffing, skills, rotation | On-call gaps, single bus factor |
| Process | How work is defined run | Missing runbook, manual steps |
| Policy | Rules, thresholds, budgets | No retry timeout, alert threshold |
| Product | What the software does by default | Client waits 30s, no fast-fail |
| External | Vendors, partners, third parties | Provider degradation, network |
Classic 6M labels (Manpower, Method, Machine, Material, Measurement, Environment) suit manufacturing; the mapping above is the same structure renamed for platforms. Either set renders identically — the branch labels are just text.
An RCA that survives a heated review is the one where the reasoning is on the page, not in someone's head. Install Mermaid Plus for Confluence, paste the fishbone and the 5 Whys into your next postmortem, and let the diagram end the argument instead of starting one.
Related Guides
- Incident postmortem timeline in Confluence — the facts half of the postmortem: detection → escalation → resolution
- How to build a release timeline in Jira — the Gantt counterpart for planning-side timelines
- Mermaid diagrams for Jira sprint workflows — flowcharts and the diagram types teams use in retros
Try Mermaid Plus for Confluence
All 29 Mermaid diagram types with live preview and one-click templates — free for up to 10 users.
Get it on the Atlassian Marketplace