CI/CD Pipeline Diagrams in Confluence with Mermaid (Copy-Paste)
A build fails at 4pm, and the fix's pipeline takes 40 minutes to re-run from the top because someone decided every stage needs to re-validate. That wasted hour is not a code problem — it is a documentation problem. Nobody could see the pipeline's shape, so nobody saw the retry loop and the gate that would have caught the failure three stages earlier.
Quick answer: put the pipeline's shape in Confluence as a Mermaid flowchart, rendered by Mermaid Plus for Confluence. Text-based, editable, diffable — a pipeline diagram that changes when your pipeline changes. This post gives you three copy-paste examples: the linear stage view, quality gates with retry loops, and the deploy-to-tag gitGraph that records what actually shipped.
Why the pipeline's shape belongs in the wiki
A diagram of your CI/CD pipeline is the answer to the three questions every teammate asks with a red build on screen:
- Where are we? Which stage failed, and what came before it
- What gets rerun? Do fixes restart the whole pipeline or just the failed stage
- Where does it stop? What has to pass for a deploy to actually go out
Text in a README answers these slowly. A diagram answers them at a glance — and because it is Mermaid text, it answers them accurately. When someone edits the pipeline, editing one arrow in the Confluence page keeps the doc honest.
Copy-paste 1: the linear stage view
Start with the version that matches your pipeline dashboard: stages in a row, biggest gate near the end. This is the diagram to lead with in the space overview — everyone recognizes their own pipeline in it.
flowchart LR
  %% title: CI/CD pipeline — linear stage view
  A[Commit] --> B[Build]
  B --> C[Unit tests]
  C --> D[Integration tests]
  D --> E[Security scan]
  E --> F[Deploy to staging]
  F --> G{Approve release?}
  G -->|yes| H[Deploy to prod]
  G -->|no| I[Reject]

Read left to right as one deploy cycle. The single decision at the end (Approve release?) is the human gate between staging and production — the box where a person, not a runner, picks what ships.
Copy-paste 2: gates, retries and rollbacks
Real pipelines branch. Flaky tests retry, security scans kill the build, and a bad prod deploy rolls back to the last good tag. Draw those forks and the diagram becomes the troubleshooting map the on-call reads:
flowchart TD
  %% title: CI/CD with quality gates and rollback
  A[Push to main] --> B[Build image]
  B --> C[Unit + integration tests]
  C -->|pass| D[Security scan]
  C -->|fail| C2[Attempt one retry]
  C2 --> C
  C2 -->|retry exhausted| F3[Block merge]
  D -->|vulnerabilities| F3
  D -->|clean| E[Deploy to staging]
  E --> F{Smoke tests ok?}
  F -->|yes| G[Deploy to prod]
  F -->|no| H[Roll back to last release tag]
  G --> I[Tag release]

Two decisions carry the whole story: the retry loop between tests and the scan (C --> C2 --> C), and the smoke-test fork after staging. The Block merge node is where a compliant pipeline stops — putting it in the diagram tells the reader the failure behavior as clearly as the success path.
Copy-paste 3: deploy-to-tag as a gitGraph
The flowchart shows the pipeline logic. The gitGraph below shows the history — which commit became a release tag, and which hotfix rode straight to prod. Keep both: the flowchart in the docs page, the gitGraph beside the release notes.
gitGraph
  title Deploy-to-tag: v1.3 hotfix ridealong
  commit id: "v1.2"
  branch release/1.3
  checkout release/1.3
  branch hotfix/payment
  checkout hotfix/payment
  commit id: "fix: timeout"
  checkout release/1.3
  merge hotfix/payment
  checkout main
  commit id: "feat: dashboard"
  checkout release/1.3
  commit id: "release: v1.3"
  checkout main
  merge release/1.3
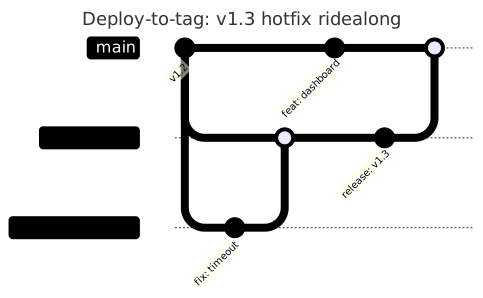
This is the diagram to attach to a release page. When the postmortem asks "did the hotfix ride along cleanly?", one glance at the gitGraph answers it — the release line, the hotfix merge, the tag.
Live vs. diagram: the tie to your actual pipeline
Mermaid's value here is not "prettier docs" — it is that the diagram is maintainable text. In Mermaid Plus for Confluence the macro is a code editor with a live preview: edit a stage name, add a gate, and the rendered SVG updates as you type. When your pipeline adds a stage (they always do), the wiki's diagram changes in the same edit that changes the pipeline — no screen-share screenshot to retake.
Teams that keep a Mermaid pipeline diagram current report the same reflex as keeping a diagram next to a sprint board: someone spots the doc drift exactly one pipeline change after it happens, because the diagram is the shortest path from "we changed it" to "write it down".
Where this lives beside your other DevOps diagrams
This is the pipeline half of the DevOps pair; the other half is the branch topology. Keep the pipeline logic as a flowchart on the space page (this post), the branch/release history as a gitGraph on the relevant issue or release page (branches & releases in Jira), and the release schedule as a Gantt on the epic (release timeline in Jira). Three diagram types, three questions, one Confluence space.
FAQ
Does Confluence have a built-in CI/CD diagram tool?
No — Confluence has no native diagramming. Mermaid Plus for Confluence renders flowchart and gitGraph from editable code blocks with a live preview.
How do I show a quality gate in a Mermaid pipeline diagram? Use a decision diamond on the arrows between stages — 'Security scan? → clean: deploy / vulnerabilities: block'. The reader sees the gate exactly where the pipeline gates.
Can a Mermaid pipeline diagram show retries and rollbacks? Yes. Draw a retry as a node pointing back at the stage it retries, and a rollback as a path from the deploy stage back to the previous release tag. See example 2.
Should a pipeline diagram be a flowchart or a gitGraph? Flowchart for pipeline logic (stages, gates, branches); gitGraph for release history (which commit became which tag). Most teams keep one of each.
Render every Mermaid diagram type — flowcharts, gitGraph, Gantt, ER and 25 more — in Mermaid Plus for Confluence, free for up to 10 users.
Try Mermaid Plus for Confluence
All 29 Mermaid diagram types with live preview and one-click templates — free for up to 10 users.
Get it on the Atlassian Marketplace